- Home
- About
- Education
- Research
- Exhibiting
- Awards & Funds
- Residency
- Brooke Army Medical Center/ San Antonio Military Medical Center
- Dwight D. Eisenhower Army Medical Center
- Madigan Army Medical Center
- Naval Medical Center Portsmouth
- Naval Medical Center San Diego
- Tripler Army Medical Center
- Walter Reed National Military Medical Center
- William Beaumont Army Medical Center
- Womack Army Medical Center
- MOTION
- Jobs
- Donate
“How to” StatisticsDaniel J. Cognetti M.D., Taylor Bates M.D., Andrew S. Murtha M.D., Jeanne C. Patzkowski M.D. Orthopedic surgeons, residents and medical students spend a great deal of time appraising and producing scientific literature, but very little time in formal medical education is allocated toward interpreting and carrying out statistical analysis. The aim of this article (or series of articles??) is to reduce this knowledge gap by explaining some fundamental components of statistical analysis. Given this is the first installment in a series of “How to” statistics articles we will highlight one of the most frequently asked questions by prospective researchers, how to choose a statistical test? How to choose a statistical test?Prior to answering the overarching question that every eager researcher seeks, we must understand the details that dictate the decision to choose one test over another. This starts with three simple questions, which will lead into a brief explanation of concepts and conclude with a decision tree for different statistical tests. 3 questions to ask when choosing a statistical test:
What are the independent and dependent variables?
Ex.Do patients with osteoporosis have a higher incidence of femoral neck fractures? Dependent variable: Femoral neck fractures Independent variable: Osteoporosis Ex. Are there differences in patient reported outcomes for open versus arthroscopic rotator cuff repair? Dependent variable: Patient reported outcomes Independent variable: Type of rotator cuff repair What is the level of measurement of the variables?Variables can be further classified along a spectrum of increasing complexity from qualitative to quantitative measurement. Understanding the differences between levels is essential for choosing an appropriate statistical test. Nominal:
Ordinal:
Interval:
Ratio:
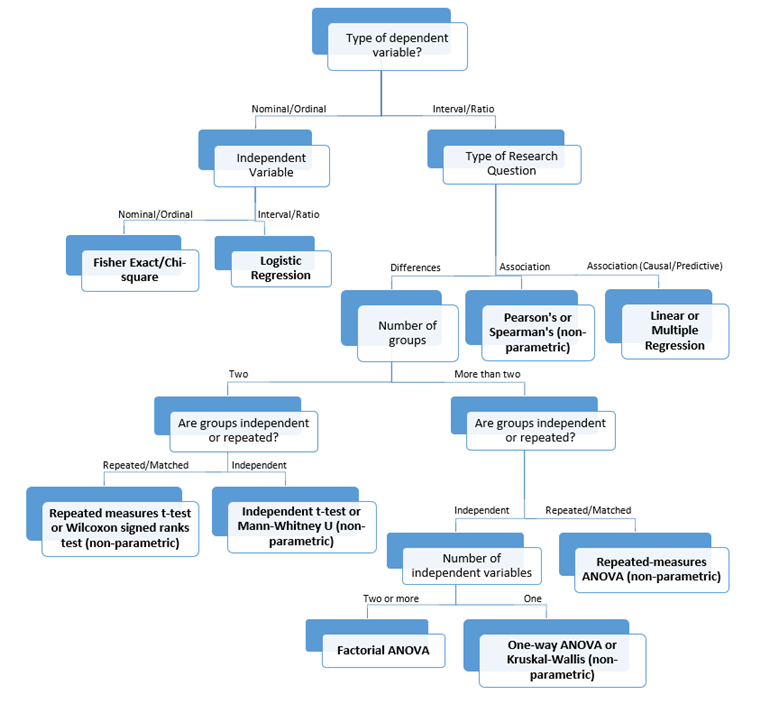
What is the experimental design?The experimental design should be driven by a well thought out research question. The research question dictates data characteristics and has implications for statistical analysis. Herein, we will detail a few components of study design with reference to statistical testing. The first important concept is that there are separate statistical tests for determining the differences between variables and determining an association between variables. Therefore prior to choosing a statistical test you must understand what inferences you are trying to make, such as whether you want to find the difference in non-union rates of scaphoid fractures in smokers and non-smokers or whether you want to see if the proportion of smokers in the union and non-union group is similar. For study of association, more advanced predictive and causal analysis can be performed through linear and multivariate regression, but these topics are out of the scope of this article. Next, it is important to understand the idea of repeated measures because it influences the amount of uncertainty in a measurement and certain tests require specification in this regard. Repeated measure signifies that there is a relationship between the groups of study. The terms paired and matched are used somewhat interchangeably but refer to two or more groups of data that are being compared. Common examples of repeated measure include before and after data, affected and contralateral side data and subject matching through coordination of baseline demographic characteristics such as age, sex and BMI. In contrast, data is considered independent (unmatched, unpaired) if the values for one group are not related to or influenced by the values from the other group. The last topic regarding experimental design and which statistical test to choose, is the idea of parametric and non-parametric tests. Parametric data has an approximately normal distribution and parametric statistical tests rely on this assumption, whereas non-parametric data is not normally distributed and non-parametric tests do not rely on normality. Parametric tests have more statistical power than non-parametric tests, but non-parametric tests are valid under more conditions. For these reasons researchers must understand when to use one or the other. The simple answer to the question of when to use parametric or non-parametric tests is based on the central limit theorem, if the sample size is 30 or more it will have normal distribution, even if it’s from a population that is not non-normally distributed. In other words, with a sample size > 30 a parametric test can be used. Alternatively, researchers can visually analyze their population data on a histogram and a scatter plot to ensure it appears normal, however, visualizing this can be difficult, especially with small samples sizes. Instead, the Kolmogorov-Smirnoff test can be used to formally determine the distribution of data, but performing this test is out of the scope of this article. Figure 1: Algorithm for choosing a statistical test
|


© 2026 The Society of Military Orthopaedic Surgeons
110 West Road, Suite 227
Towson, MD 21204
866-494-1778
[email protected]